
4n6ir.com
Windows Prefetch: Overview of New Research in Sections A & B
by James Habben
The data stored in Prefetch trace files (those with a .pf extension) is a topic discussed quite a bit in digital forensics and incident response, and for good reason. It provides a great record of the executables that have been used, and Windows is configured to store them by default for workstation systems. In this article, I am going to add just a little bit more to the type of information that we can glean from one of these trace files.
File Format Review
The file format of Prefetch trace files has changed a bit over the years and those changes have generally included more information for us to take advantage of in our analysis. In Windows 10 for example, we were thrown a curve ball in that the prefetch trace files are now being stored compressed, for the most part.
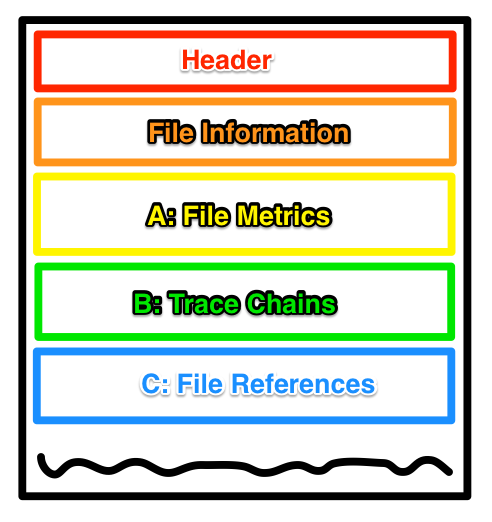
The image below shows just the top portion of the trace files. The header and file information sections have been the recipient of the most version changes over the years. The sections following are labeled with letters as well as names according to Joachim’s document on the prefetch trace file format. The document does state that the name of section B is only based on what is known to this point, so it might change in the future. I hope that image isn’t too offensive. Drawing graphics is not a specialty of mine.
New Information, More Work
The information that I am writing about here is the result of many drawn out years and noncontiguous time of research. I have spent way too much time in IDA trying to analyze kernel level code (probably should just bite the bullet and learn WinDbg) and even more time watching patterns emerge as I stare deeply into the trace file contents. It is not fully baked, so I am hoping that what I explain here can lead to others, smarter than me, to run with this even further. I think there is more exciting things to be discovered still. I have added code to my fork of the windows-prefetch-parser python module, which I forked a while back to add SQLite output, and I will get a pull request into the main project in short time. This code adds just a bit of extra information in the standard display output, but there is also a -v option to get a full dump of the record parsing. (warning, lots of data)
File Usage - When
The first and major thing that I have determined is that we can get additional information about the files used (section C) in that we can specify which of the last 8 program executions took advantage of each file. We have to combine data from all three sections (A, B, and C) in order to get this more complete picture, something that the windows prefetcher refers to as a scenario. This can also help to explain why files can show up in trace files and randomly disappear some time later. Take a look at this image for a second.

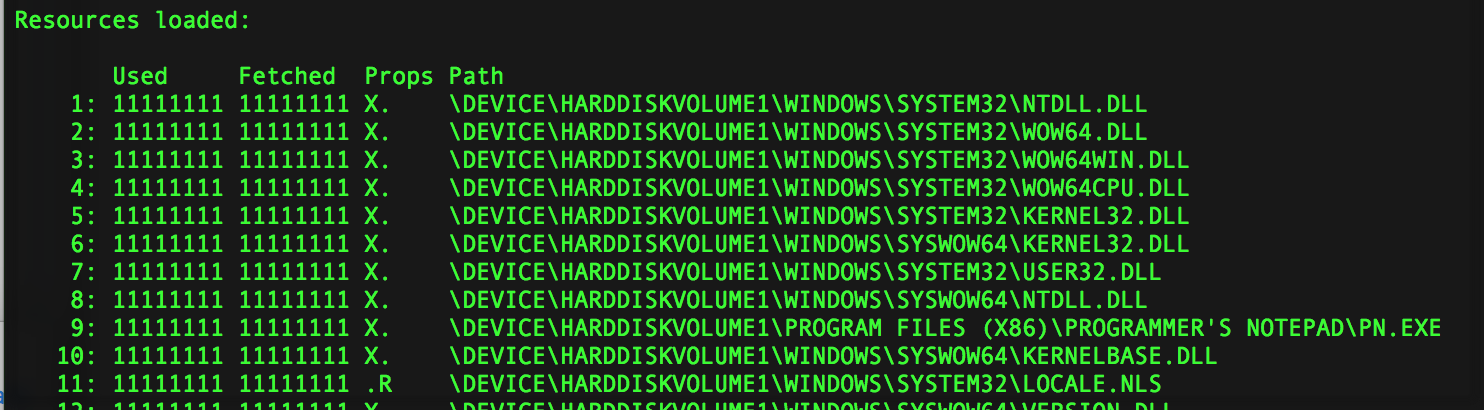
This trace file is for Programmer’s Notepad (pn.exe) and was executed on a Windows 8 virtual machine. I created several small, unique text files to have distinct records for each program execution. I used the command line to execute pn.exe while passing it the name of each of those text files. I piped the output into grep to minimize the display data for easier understanding here.
There are two groups of 8 digits, and these are a bitfield. The left group represents the program triggering a page fault (soft or hard) to request data from the file. The right group represents the prefetcher doing a proactive grab of the data from that file, as this is the whole point to have data ready for the soft fault and to prevent the much more costly hard fault. In typical binary representation, a zero is false and a one is true. Each time the program is executed, these fields are bitshifted to the left. This makes the right side the most recent execution and each column working left is the scenario prior, going up to eight total.
If you focus on an imaginary single file being used by an imaginary program, the bitfield would look like this over eight runs.
0000000<span style="color:#cc0000;">1</span>
000000<span style="color:#cc0000;">1</span>0
00000<span style="color:#cc0000;">1</span>00
0000<span style="color:#cc0000;">1</span>000
000<span style="color:#cc0000;">1</span>0000
00<span style="color:#cc0000;">1</span>00000
0<span style="color:#cc0000;">1</span>000000
<span style="color:#cc0000;">1</span>0000000
What happens after eight runs? I am glad you asked. If the value of this bitfield ends up being all zero’s, the file is removed from section C, and all associated records are removed from sections A and B. Interestingly, the file is not removed from the layout.ini file that sits beside all these trace files; not immediately, from what I have been able to determine.
If the file gets used again before that 1 gets pushed out, then the sections referencing that file will remain in the trace file.
0000000<span style="color:#cc0000;">1</span>
000000<span style="color:#cc0000;">1</span>0
00000<span style="color:#cc0000;">1</span>00
0000<span style="color:#cc0000;">1</span>000
000<span style="color:#cc0000;">1</span>000<span style="color:#cc0000;">1</span>
00<span style="color:#cc0000;">1</span>000<span style="color:#cc0000;">1</span>0
0<span style="color:#cc0000;">1</span>000<span style="color:#cc0000;">1</span>00
<span style="color:#cc0000;">1</span>000<span style="color:#cc0000;">1</span>000
000<span style="color:#cc0000;">1</span>0000
00<span style="color:#cc0000;">1</span>0000<span style="color:#cc0000;">1</span>
0<span style="color:#cc0000;">1</span>0000<span style="color:#cc0000;">1</span>0
<span style="color:#cc0000;">1</span>0000<span style="color:#cc0000;">1</span>00
0000<span style="color:#cc0000;">1</span>000
etc.
File Usage - How
The second part, and the one that needs more research, is how this file was used by the executing program. There are some flag fields in both section A and B that provide a few values that have stuck out to me. There are other values that I have observed in these flag fields as well, but I have not been able to make a full determination about their designation yet.
The flag field that I have focused on is housed in section A. The three values that I have found purpose behind seem to represent 1) if a file was used to import executable code, 2) if the file was used just to reference some data, perhaps strings or constants, and 3) if the file was requested to not be prefetched. You will mostly see DLL files with the executable flag, although there are some that are referenced as a resource. You will find most of the other files being used as a resource.
In the output of windowsprefetch, I have indicated these properties as follows:
- X Executable code
- R Resource data
- D Don’t Prefetch
See some examples of these properties in the output below from pn.exe.
More Tech to Follow
I am going to stop this post here because I wanted this to be more of a higher level overview about the ways we can use these properties. I will be writing another blog post that gets into a little more gory detail of the records for those that might be interested.
Please help the community in this by testing the tool and the data that I am presenting here. Samples are in the GitHub repo. This has all been my own research, and we need to validate my findings or correct my mistakes. Take a few minutes to explore some of your system’s prefetch files.
https://github.com/JamesHabben/Windows-Prefetch-Parser
You can comment below, DM me on twitter, or email me first@last.net if you have feedback. Thanks for reading!
James Habben
tags: Prefetch